Inequality in the Medway
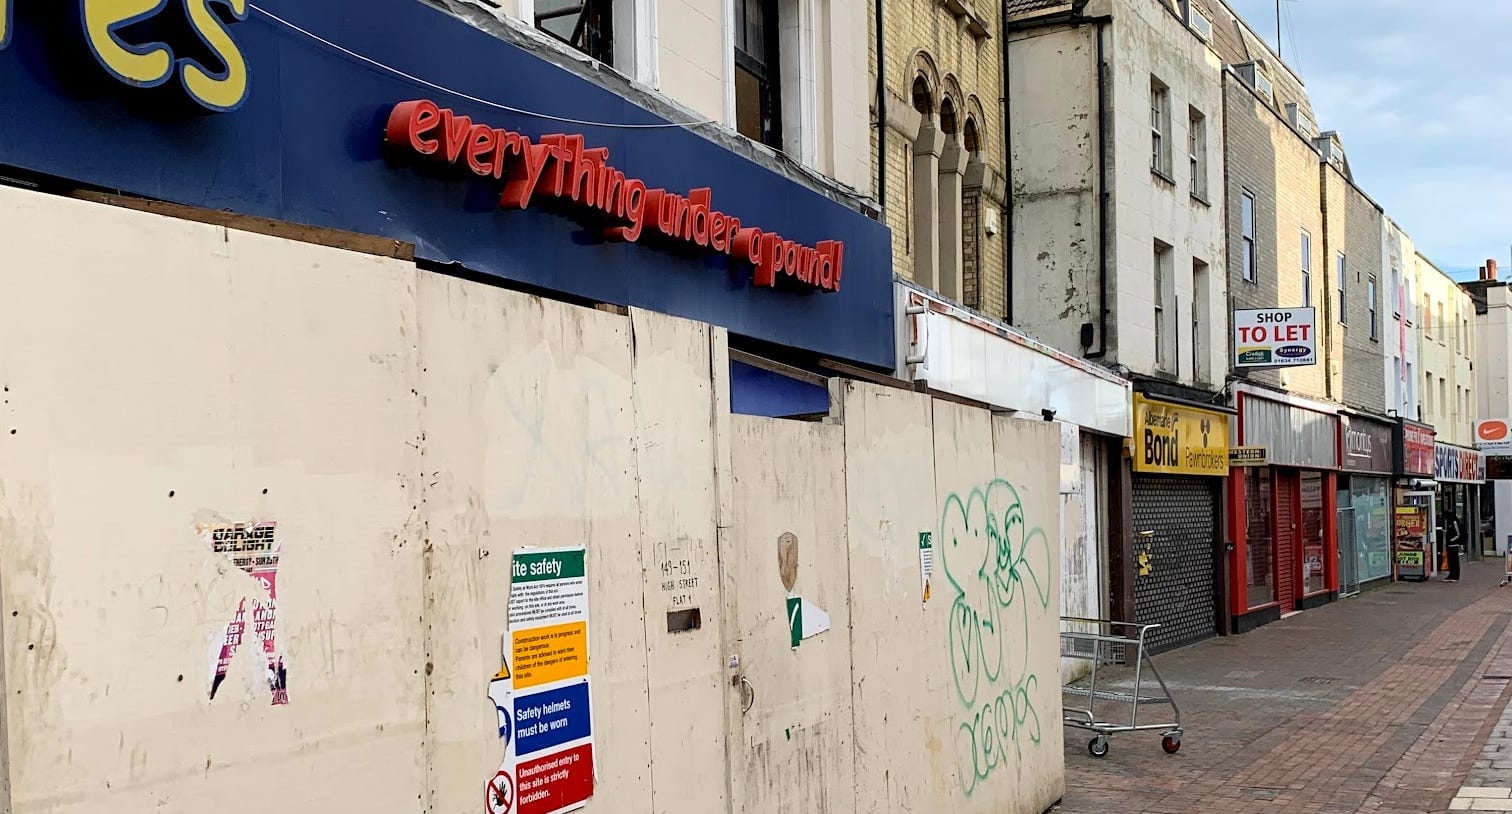
Another piece that talks our towns down by highlighting statistics in Medway Council's own monitoring report

It is, at the time of publication, less than two weeks to go before Christmas. Or Winterval Festival as we call it around Local Authority Towers. It seemed a good time to look at poverty in Medway, at the Indices of Deprivation, and the inequality it causes. Not because championing the ‘politics of envy’ is a good thing, but because thinking a child should not go hungry shouldn’t be an outlier position.
The purpose of the Indices of Deprivation is to measure - as accurately as possible - the relative distribution of deprivation at a local area level.
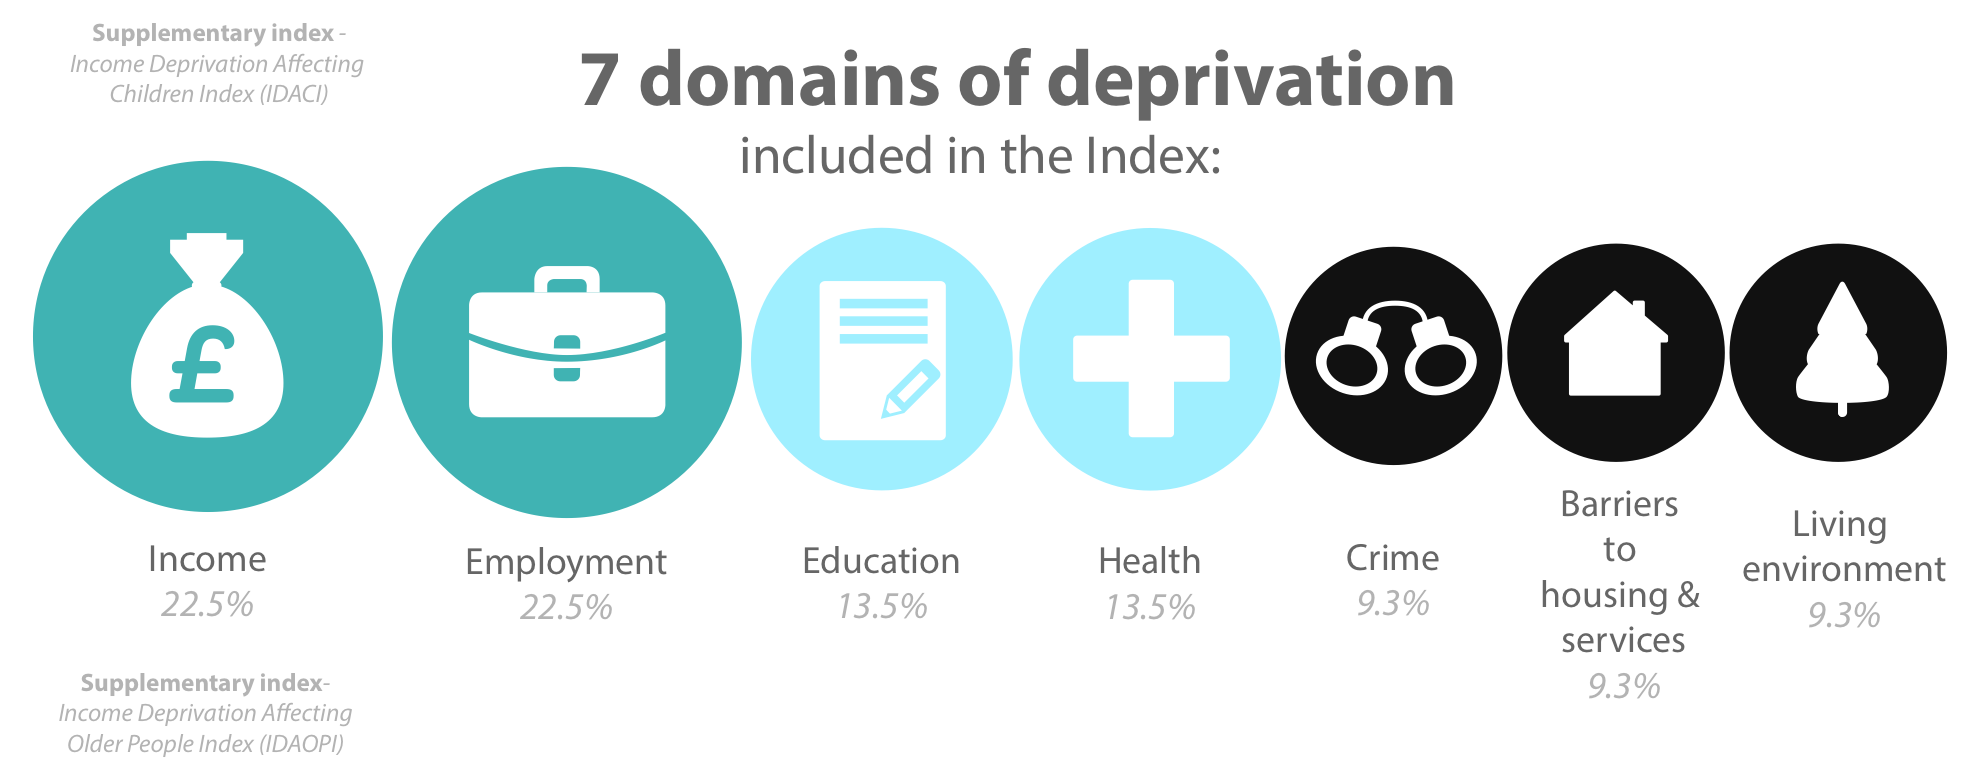
The above graphic is how the government’s statistics authority decides how deprived a neighbourhood is, with a sliding scale from 22.5% of the score made from income down to 9.3% based on the living environment.
When interpreting the neighbourhood-level data, the 32,844 Lower-Layer Super Output Areas - or neighbourhoods - in England are ranked according to their deprivation score. For each of the neighbourhood-level indices, the most deprived lower-layer Super Output Area in England is given a rank of 1, and the least deprived a rank of 32,844. Decile 1 represents the most deprived 10% of areas nationally and decile 10 represents the least deprived 10% of areas nationally.
The ranks (and deciles) are relative: they show that one area is more deprived than another but not by how much. For example, if an area has a rank of 1,000, it is not half as deprived as a place with a rank of 500.
The ranks and deciles are based on scores: the larger the score, the more deprived the area. If a neighbourhood has a score of 0.38 in the Income Deprivation Domain, this means that 38 per cent of the population is income deprived in that area. The neighbourhood-level indices provide a description of areas, but this description does not apply to every person living in those areas. Many non-deprived people live in deprived areas, and many deprived people live in non-deprived areas. The indices do not capture or compare relative levels of wealth or affluence, so a lower-ranked area could be described as less deprived, but not as more affluent or richer. Similarly, the least deprived area in the country should not be described as the most affluent or richest. As the riches will be held offshore of course, for simplicity of tax-keeping purposes.
The English Indices of Deprivation (IoD) are an important tool for identifying the most disadvantaged areas and for supporting decisions about addressing local needs. The IoD is something we have looked at before. here and here. There is also a very good piece by Medway councillor Naushabah Khan on ‘Levelling Up’ here. We also recommend The Spirit Level: Why More Equal Societies Almost Always Do Better by Kate Pickett and Richard Wilkinson, which states the "pernicious effects that inequality has on societies: eroding trust, increasing anxiety and illness, (and) encouraging excessive consumption"
An important part of income inequality cannot be attributed to differences in individual efforts or responsibility. On the contrary, it can be directly ascribed to outside factors such as family background, gender, race and place of birth – a higher degree of income inequality is also characterised by greater inequality of opportunity.
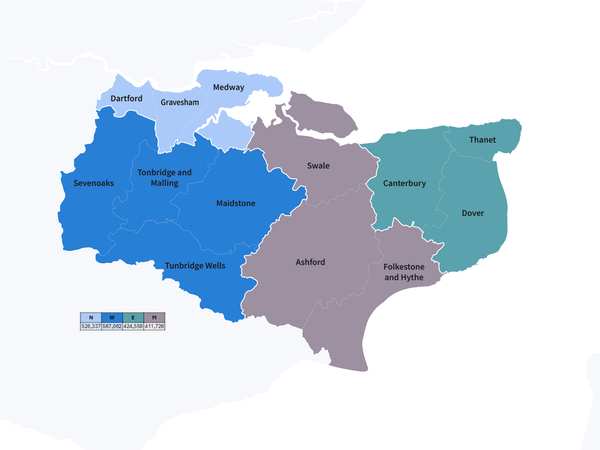
So, now we know what the numbers mean, where does Medway stand?